Create A Chart From Excel
Create an Organizational Chart using Microsoft Excel as your data source.

TeamOrgChart can create organizational charts from Microsoft Excel.
The spreadsheet must contain:
An ID Column: a column that uniquely identifies each person.
A Manager Column: a column that identifies each individual's manager.
These two columns form the basis for creating the hierarchy.
The column 'types' must match. For example, if you use an email address for the ID, you must use an email address for the Manager.
The other columns in the spreadsheet are used to show data within the organization chart.
Typically, these will include things such as name, job title, department, and telephone number. However, there are no specific requirements. The additional columns can be displayed in the chart boxes, used within conditional rules, and shown in the information pop-up window.

1. Create Org Chart
From the Dashboard, select Create Org Chart.
2. Name the Chart
Name the chart and select Microsoft Excel as the data source.
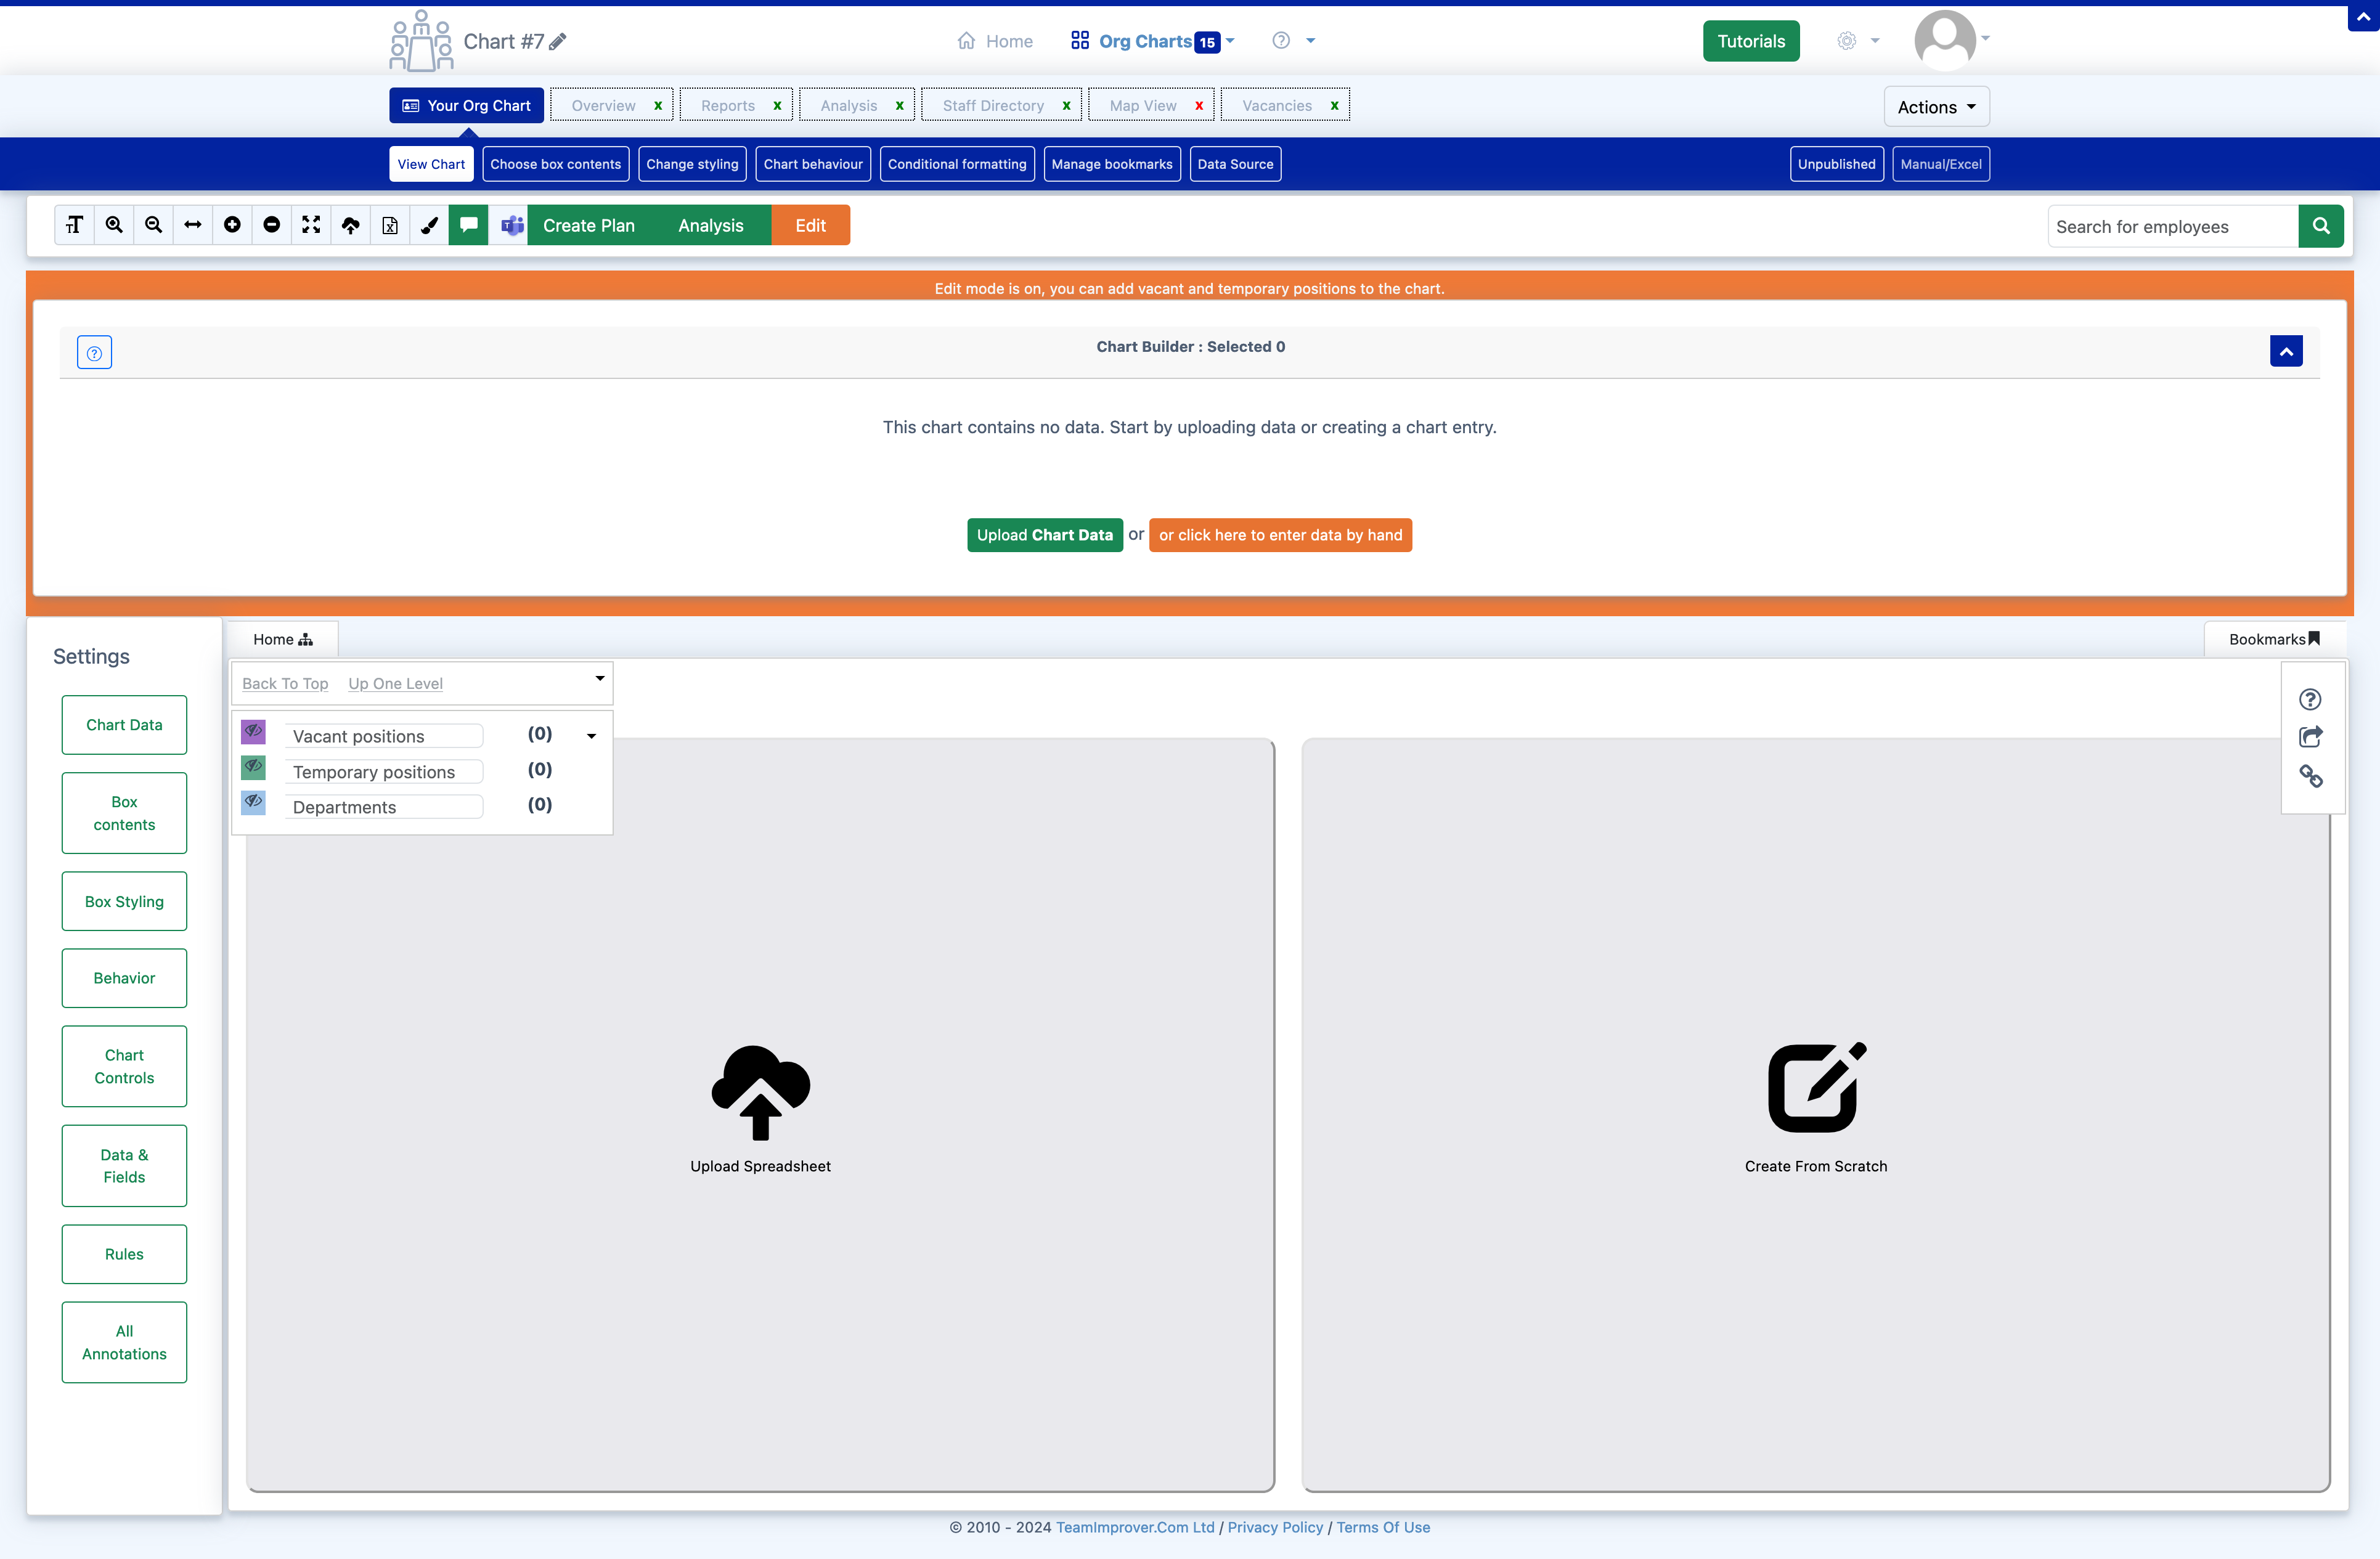
3. Upload Spreadsheet
Drag and drop your Microsoft Excel spreadsheet onto the spreadsheet upload panel. Or click the 'Upload' button and then browse and locate your file.
You’ll see a table showing a portion of the spreadsheet data. Click 'Import Positions' to load it into TeamOrgChart.
4. Select ID and Manager
At the next step, you are required to pick the columns from your spreadsheet data that hold the Unique and Manager Id’s. At this point you can also give TeamOrgChart hints as to which columns contain names, email addresses and departments.
5. Build the Chart
TeamOrgChart will attempt to locate the person at the top of the organization and display the first three levels of the chart starting from their position.
The chart is now ready for further customisation.
If you only see a single box with your own details, it’s likely that your Entra ID directory is missing the necessary manager information.
To troubleshoot this, visit the Analysis Page and run the report. This will validate your data and check for any issues that may be causing the problem.